
Foundation, Key Stage 1 and Key Stage 2 Results
2023/2024
2022/2023
2021/2022
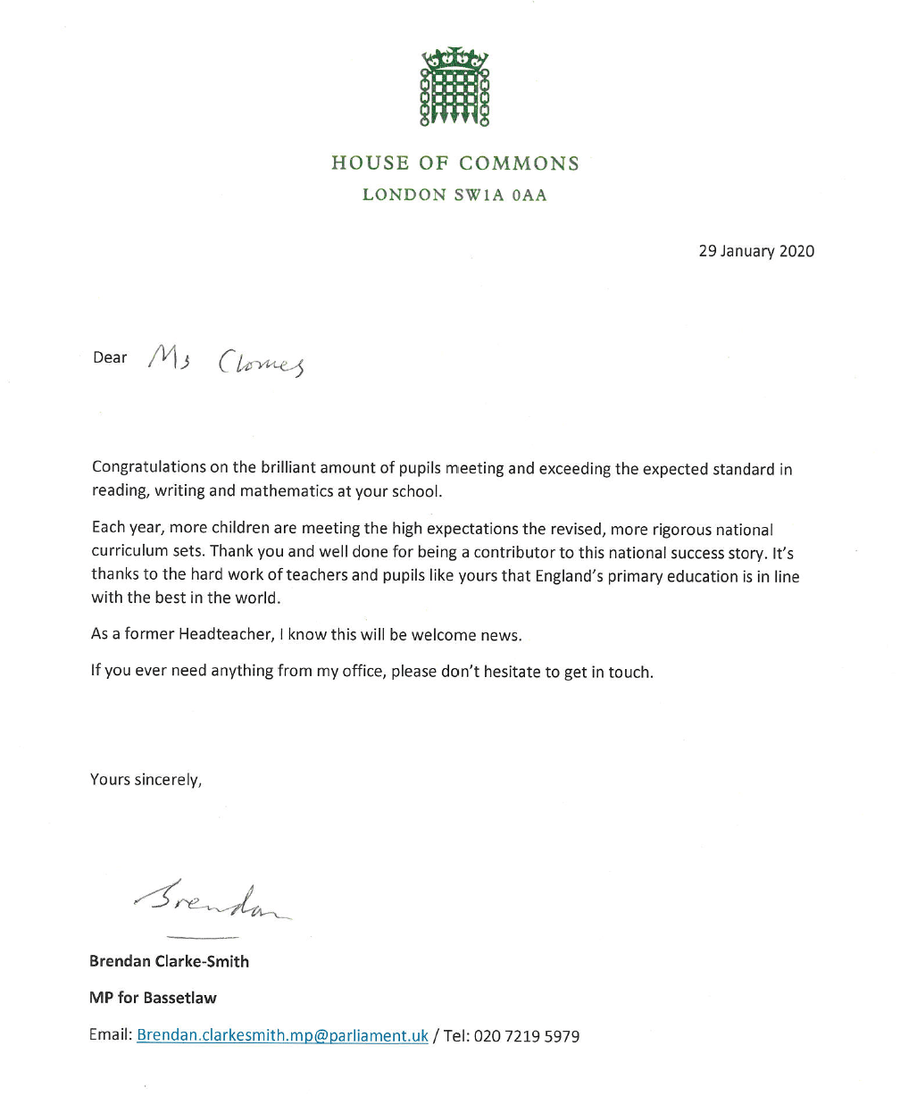
In February 2020 we received two amazing letters about the standard of education at our school. The first letter was from the House of Commons to congratulate us on 'the brilliant amount of pupils reaching and exceeding the expected standard in reading, writing and mathematics'.
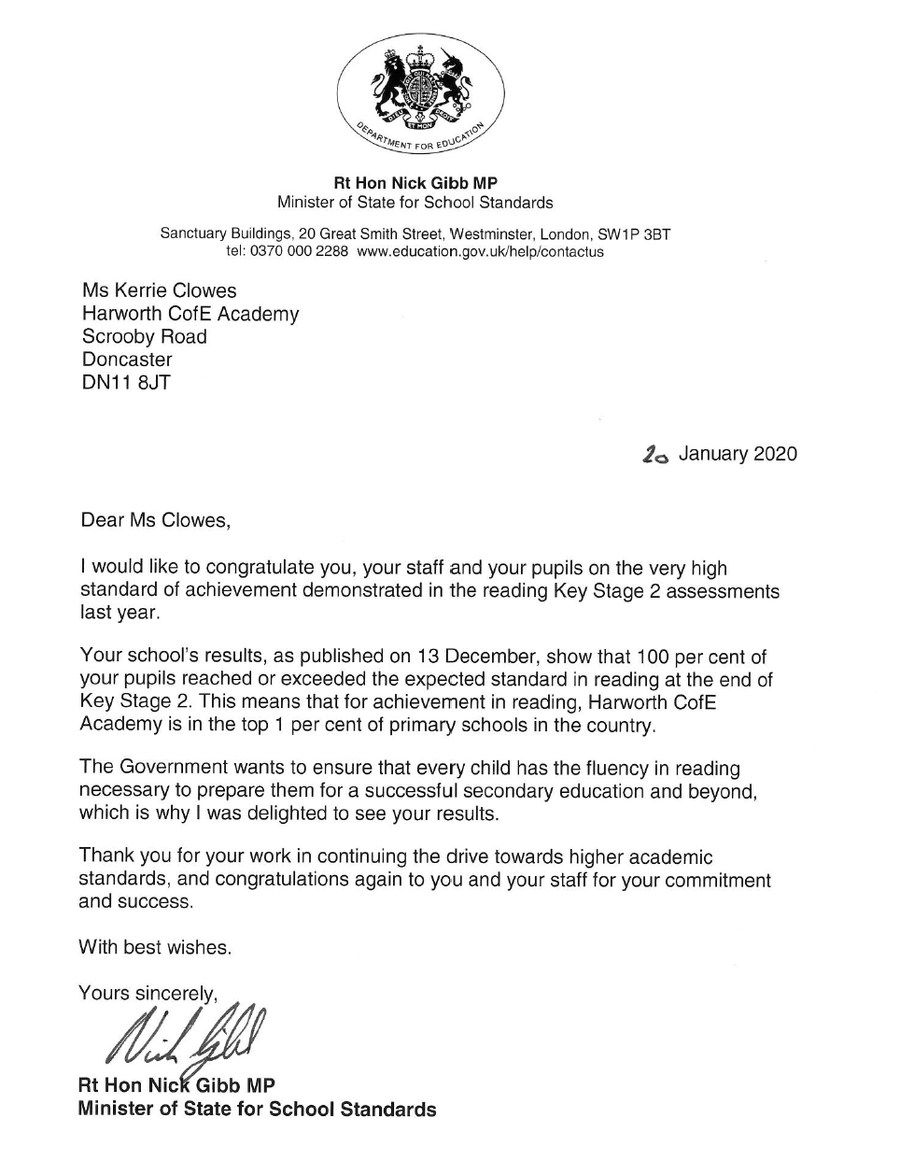
The second letter was from the Rt Hon Nick Gibb MP who is the Minister of State for School Standards. As a school we are in the top 1% of primary schools for reading as 100% of our pupils achieved the expected standard or above in the end of key stage 2 results. We are so proud of amazing school - Amaze.Achieve.Aspire. Together
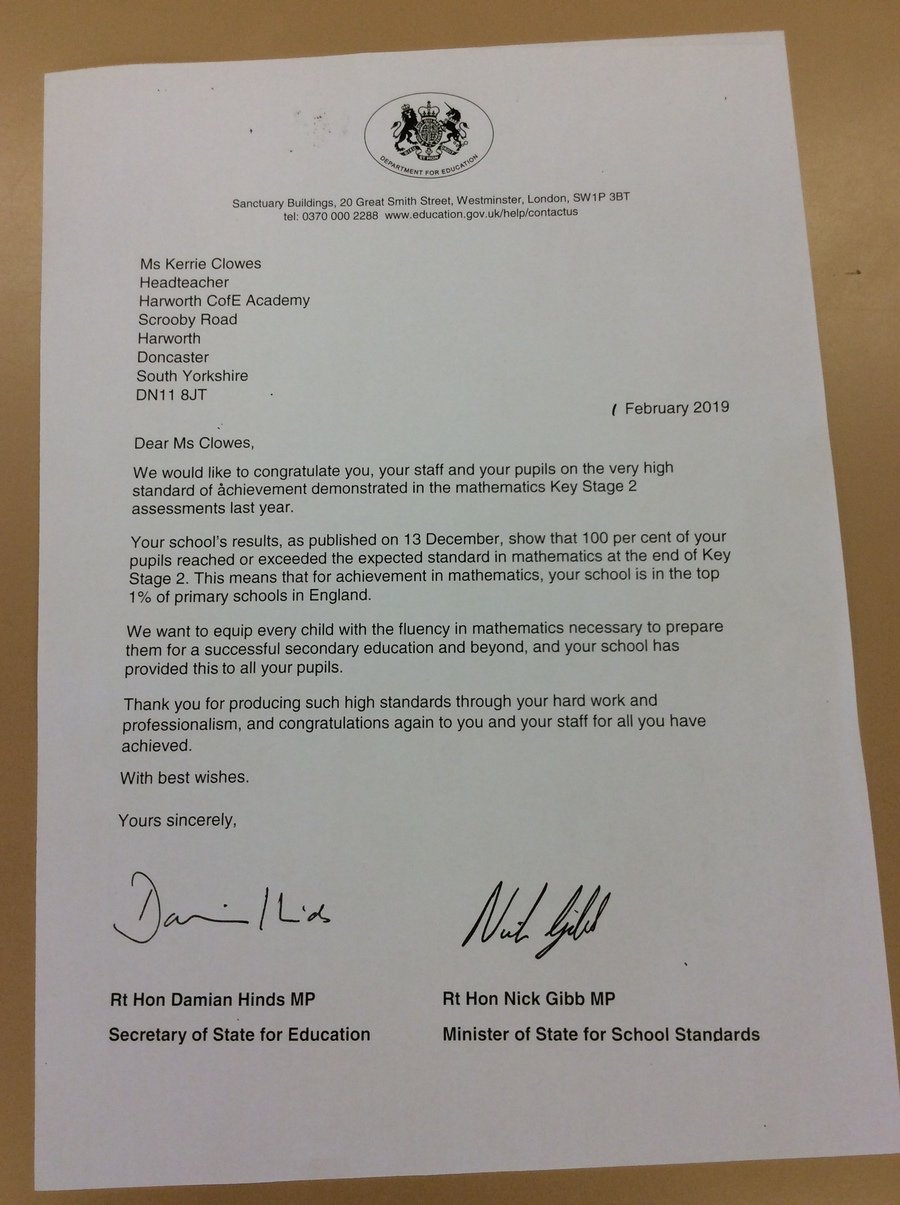
In February 2019 we received an amazing letter from the Secretary of State for Education and the Minister of State for School Standards. We are in the top 1% of primary schools for mathematics as 100% of our pupils achieved expected standard or above at the end of key stage 2. What an amazing achievement!
EYFS, Phonics Check, Key Stage 1 and 2 SAT Results 2019
|
Key Stage 2 |
Number in Cohort: 28 |
|
|
|
|
% achieving the expected standard+: |
Reading |
Writing |
Maths |
% achieving expected standard + combined: |
|
|
100 |
93 |
96 |
89 |
|
% achieving greater depth: |
Reading |
Writing |
Maths |
|
|
|
18 |
35 |
14 |
|
|
|
|
|||
|
|
Average scaled score in Reading is 105
Average scaled score in Maths is 105
|
Key Stage 1 |
Number in Cohort: 26 |
|
|
|
|
% achieving the expected standard+: |
Reading |
Writing |
Maths |
|
|
|
88.5 |
80.8 |
88.5 |
|
|
% achieving greater depth: |
Reading |
Writing |
Maths |
|
|
|
23 |
19 |
23 |
|
|
|
||||
|
|
|
|
|
EYFS Number in Cohort: |
25 |
|
% achieving a good level of development: |
85 |
|
Year 1 Phonics Number in Cohort: |
30 |
|
% passing phonics test: |
77 |
EYFS, Phonics Check, Key Stage 1 and 2 SAT Results 2018
|
Key Stage 2 |
Number in Cohort: 27 |
|
|
|
|
% achieving the expected standard: |
Reading |
Writing |
Maths |
|
|
|
60 |
55 |
78 |
|
|
% achieving greater depth: |
Reading |
Writing |
Maths |
|
|
|
33 |
41 |
22 |
|
|
% achieving expected standard+:
|
Reading |
Writing |
Maths |
% achieving expected standard + combined: |
|
|
93 % |
96 % |
100 % |
93 % |
Average scaled score in Reading is 107
Average scaled score in Maths is 107
Average progress score in Reading is 0.74
Average progress score in Writing is 3.42
Average progress score in Maths is 0.47
|
Key Stage 1 |
Number in Cohort: 30 |
|
|
|
|
% achieving the expected standard: |
Reading |
Writing |
Maths |
|
|
|
80 |
80 |
83 |
|
|
% achieving greater depth: |
Reading |
Writing |
Maths |
|
|
|
20 |
20 |
17 |
|
|
% achieving expected standard+:
|
Reading |
Writing |
Maths |
|
|
|
80 % |
80 % |
80 % |
|
|
EYFS Number in Cohort: |
23 |
|
% achieving a good level of development: |
82.61 |
|
Year 1 Phonics Number in Cohort: |
29 |
|
% passing phonics test: |
79 |
EYFS, Phonics Check, Key Stage 1 and 2 SAT Results 2017
|
Key Stage 2 |
Number in Cohort: 27 |
|
|
|
|
% achieving the expected standard: |
Reading |
Writing |
Maths |
|
|
|
62.96 |
60.71 |
77.77 |
|
|
% achieving greater depth: |
Reading |
Writing |
Maths |
|
|
|
29.6 |
39.28 |
22.2 |
|
|
% achieving expected standard+:
|
Reading |
Writing |
Maths |
% achieving expected standard + combined: |
|
|
92.59 % |
100 % |
100 % |
92.59 % |
Average scaled score in Reading is 107.15
Average scaled score in Writing is 106.88
Average progress score in Reading is -0.4
Average progress score in Writing is 2.82
Average progress score in Maths is -0.5
|
Key Stage 1 |
Number in Cohort: 28 |
|
|
|
|
% achieving the expected standard: |
Reading |
Writing |
Maths |
Combined |
|
|
50 |
53.57 |
57.14 |
46.42 |
|
% achieving greater depth: |
Reading |
Writing |
Maths |
Combined |
|
|
39.28 |
32.14 |
32.14 |
28.57 |
|
% achieving expected standard+:
|
Reading |
Writing |
Maths |
% achieving expected standard + combined: |
|
|
89.28 % |
85.71 % |
89.28 % |
85.71 %
|
|
EYFS Number in Cohort: |
23 |
|
% achieving a good level of development: |
82.61 |
|
Year 1 Phonics Number in Cohort: |
29 |
|
% passing phonics test: |
79 |
Key Stage 1 and 2 results 2015-2016
Report on Key Stage 2 SAT Results 2016
Percentage of pupils reaching the expected standard (higher standard in brackets):
|
|
Reading |
Writing |
Grammar and Spelling |
Maths |
Combined R W M |
Combined W M |
Combined G W M |
|
National |
66 (19) |
74 (15) |
72 (23) |
70 (17) |
53 |
|
|
|
Harworth |
62 (12) |
100 (38) |
81 (15) |
69 (12) |
54 (4)
|
69
|
61.5
|
Report on Key Stage 1 SAT Results 2016
Reading 72%
Writing 68.4%
Maths 86.4%
Reading/Writing/Maths combined 64.8%
Year 1 Phonics Screening 86%
EYFS 79% reached a good level of development
Key Stage 1 and 2 results 2014-2015
Report on Year 6 SAT Results 2015
Reading: 100 % Level 4+
39.2 % Level 5
92.8% achieved at least 2 levels progress
28.6% achieved more than 2 levels progress
Writing: 100% Level 4+
32.4% Level 5+
3.6% Level 6
100% achieved at least 2 levels progress
25.2% achieved more than 2 levels progress
English Grammar
Punctuation and
Spelling: 85.7% Level 4+
32.4% Level 5
Maths: 96.4% Level 4
21.6% Level 5+
92.8% achieved at least 2 levels progress
7% achieved more than 2 levels progress
Key Stage 1 Year 2 SAT results 2015
Reading
Level 2+100% Level 3+ 40%
Writing
Level 2 100% Level 3 36%
Maths
Level 2 100% Level 3 33%
Reading/Writing/maths combined Level 2 100% Level 3 23.1%
Year 1 Phonics screening
89%
EYFS 75% reached a good level of development
Year 2 Sat 2014.
Reading
Level 2+ - 93.6% Level 3 - 36%
Writing
Level 2+ - 93.6% Level 3 - 21.6%
Maths
Level 2+ - 100% Level 3 - 32.4%
Year 6 Sat results 2014
Reading
Level 4+ - 96.6%
Level 5 - 68%
Writing
Level 4+ - 82%
Level 5+ - 40.8%
Level 6 - 13%
English Grammar, punctuation and spelling
Level 4+ - 82%
Level 5 - 40.8%
Maths
Level 4+ - 82%
Level 5+ - 28%
Level 6 - 3%
To access DFE performance tables go to https://www.compare-school performance.service.gov.uk/school/141536/harworth-cofe-academywww.education.gov.uk/schools/performance/index.html